Pie Charts with Percentages
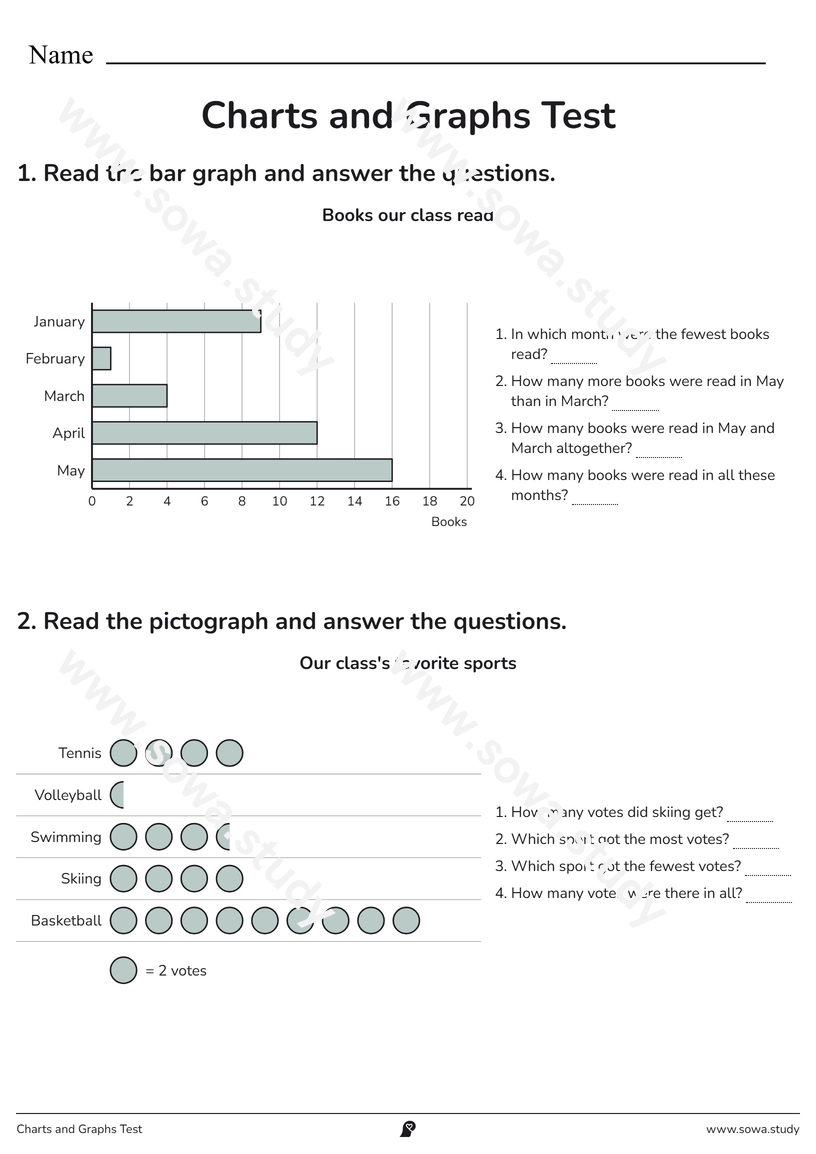
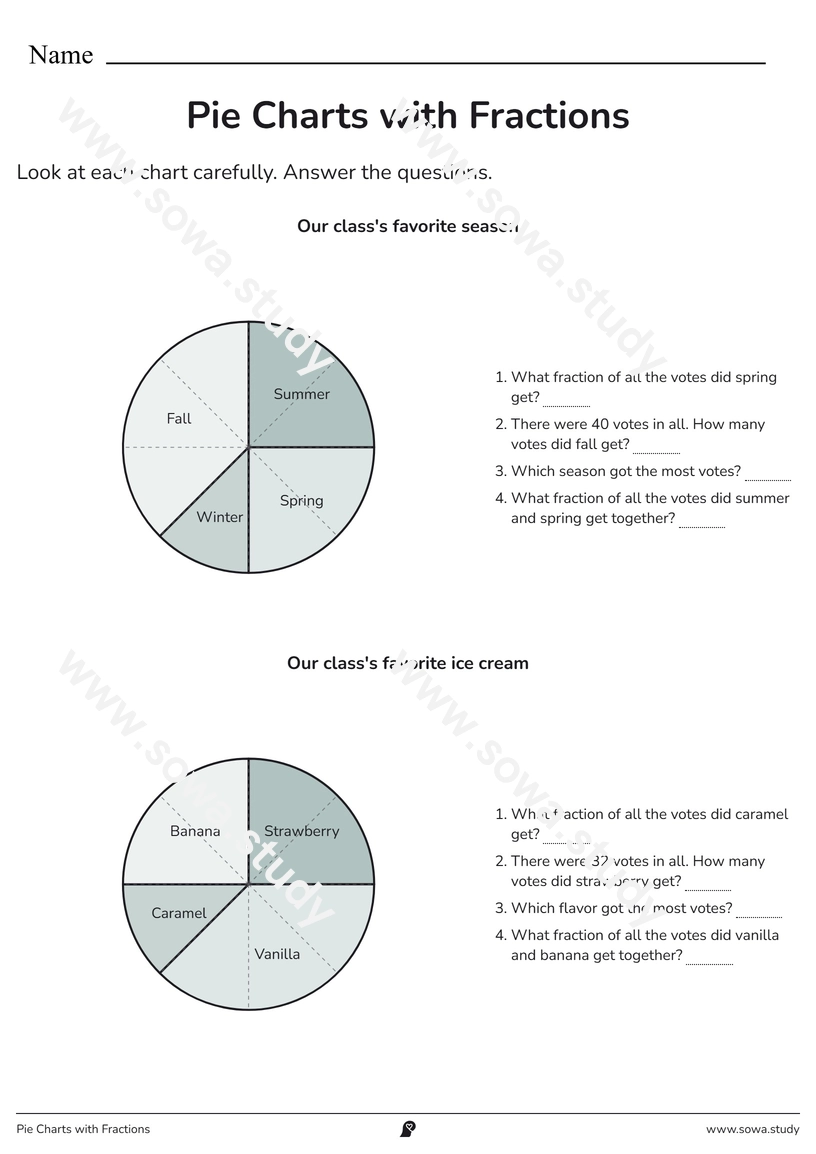
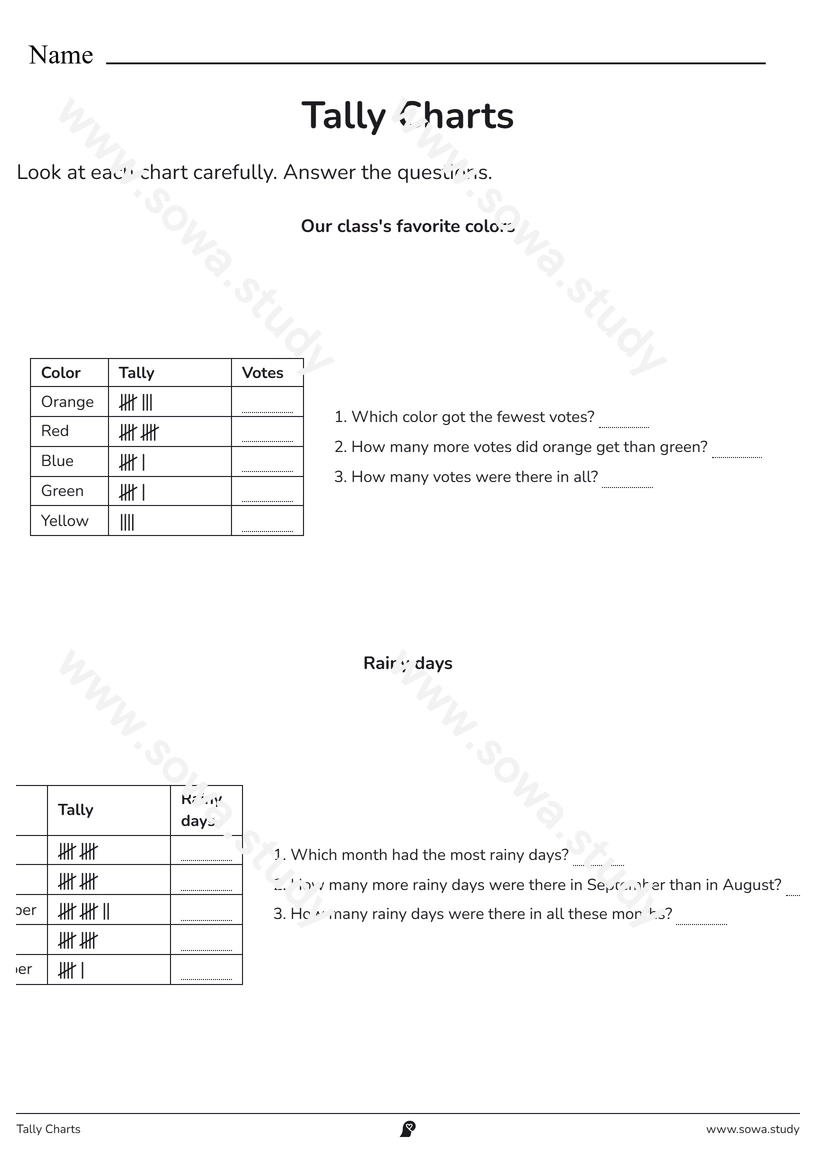
Look at each chart carefully. Answer the questions.
Our class's favorite season
- There were 100 votes in all. How many votes did fall get?
- Which season got the most votes?
- Which season got the fewest votes?
- What percentage of the votes did summer and spring get together?
Our class's favorite colors
- There were 20 votes in all. How many votes did red get?
- Which color got the most votes?
- Which color got the fewest votes?
- What percentage of the votes did red and green get together?