Charts and graphs worksheets
Free printable graphing worksheets: pictographs, tally charts, bar graphs, line graphs and pie charts to read and to draw, with new data on every print and an answer key.
 Dynamic
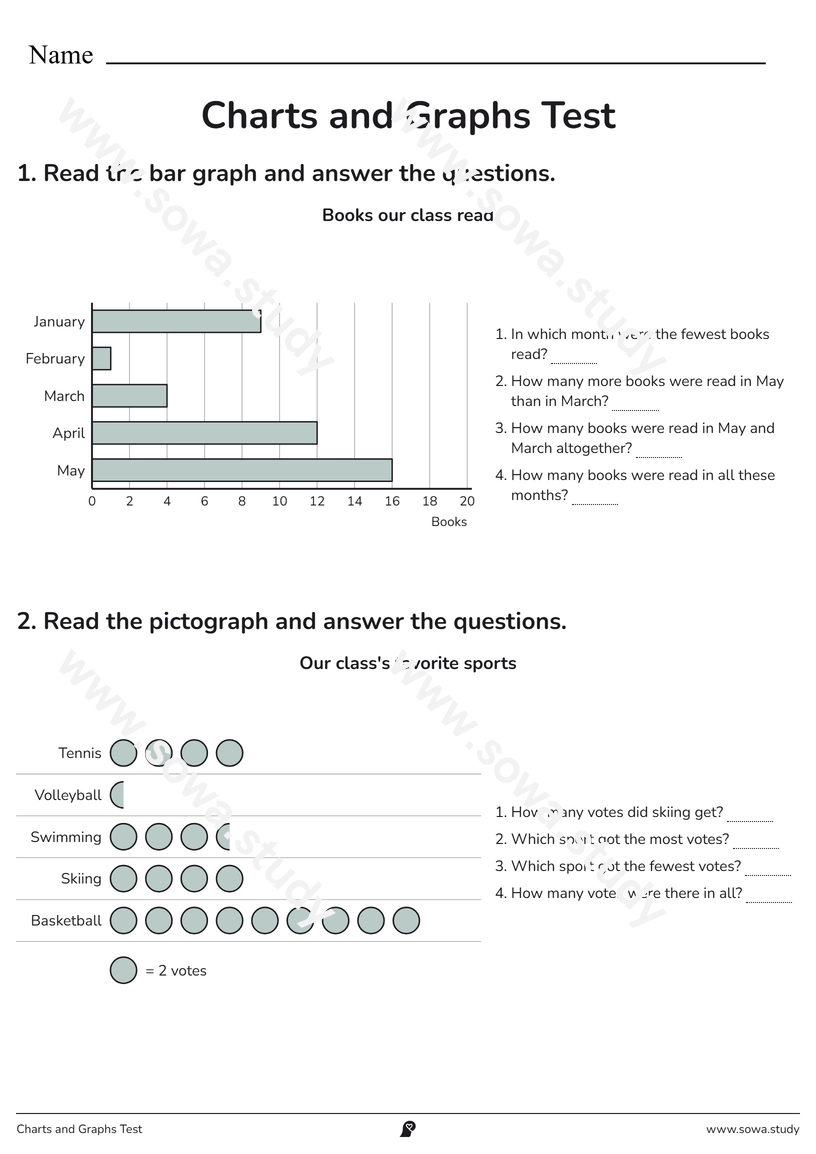
Charts and Graphs Test
A review of bar graphs, pictographs and line graphs, with questions on each.
 Dynamic
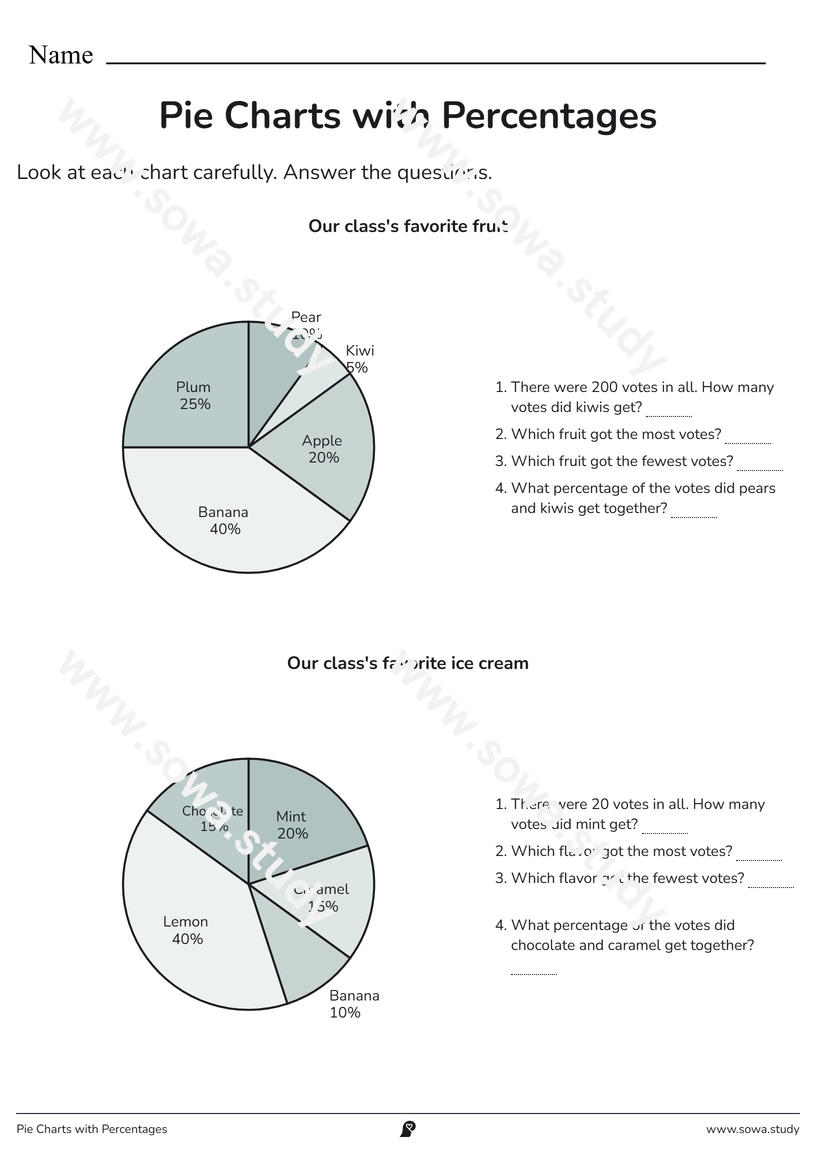
Pie Charts with Percentages
Read pie charts labelled in percent and work out how many votes each slice is.
 Dynamic
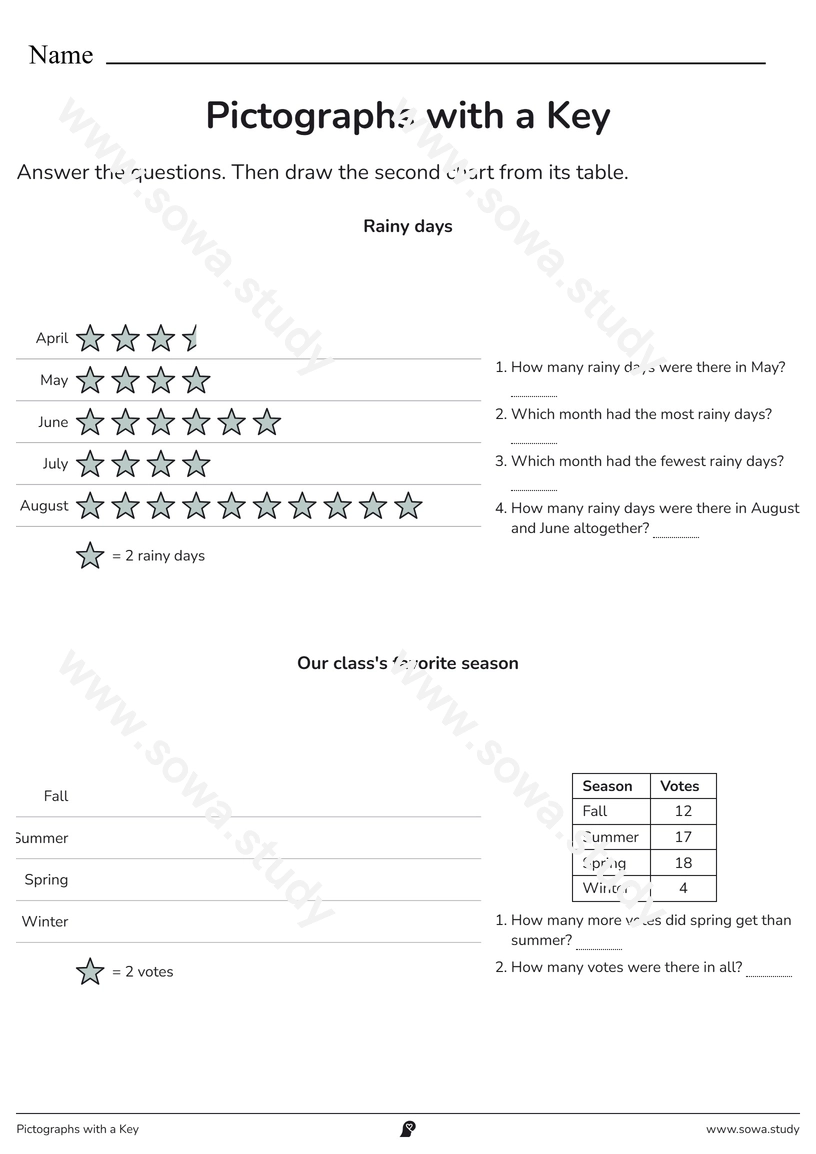
Pictographs with a Key
Read pictographs where one picture stands for 2 votes and half a picture for 1, then draw one.
 Dynamic
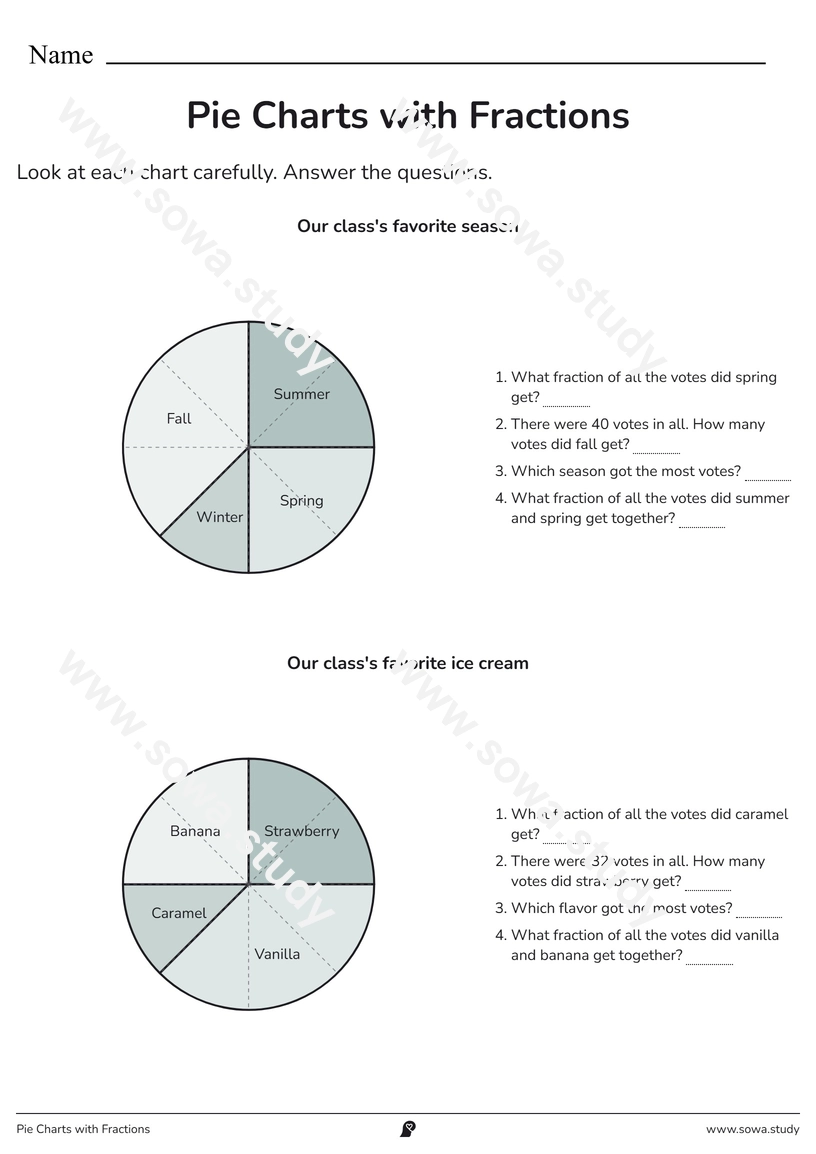
Pie Charts with Fractions
Read pie charts cut into eighths: what fraction voted for each, and how many votes that is.
 Dynamic
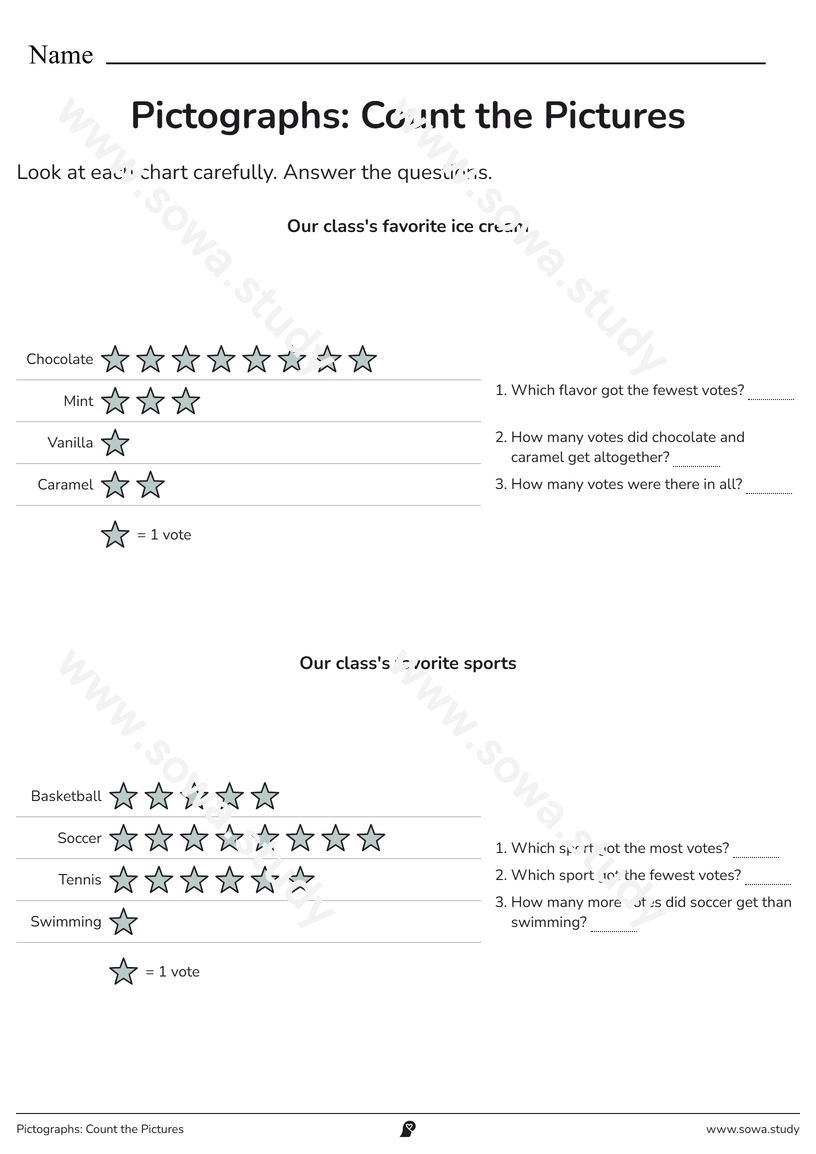
Pictographs: Count the Pictures
Read simple pictographs where each picture is one vote, and answer questions about them.
 Dynamic
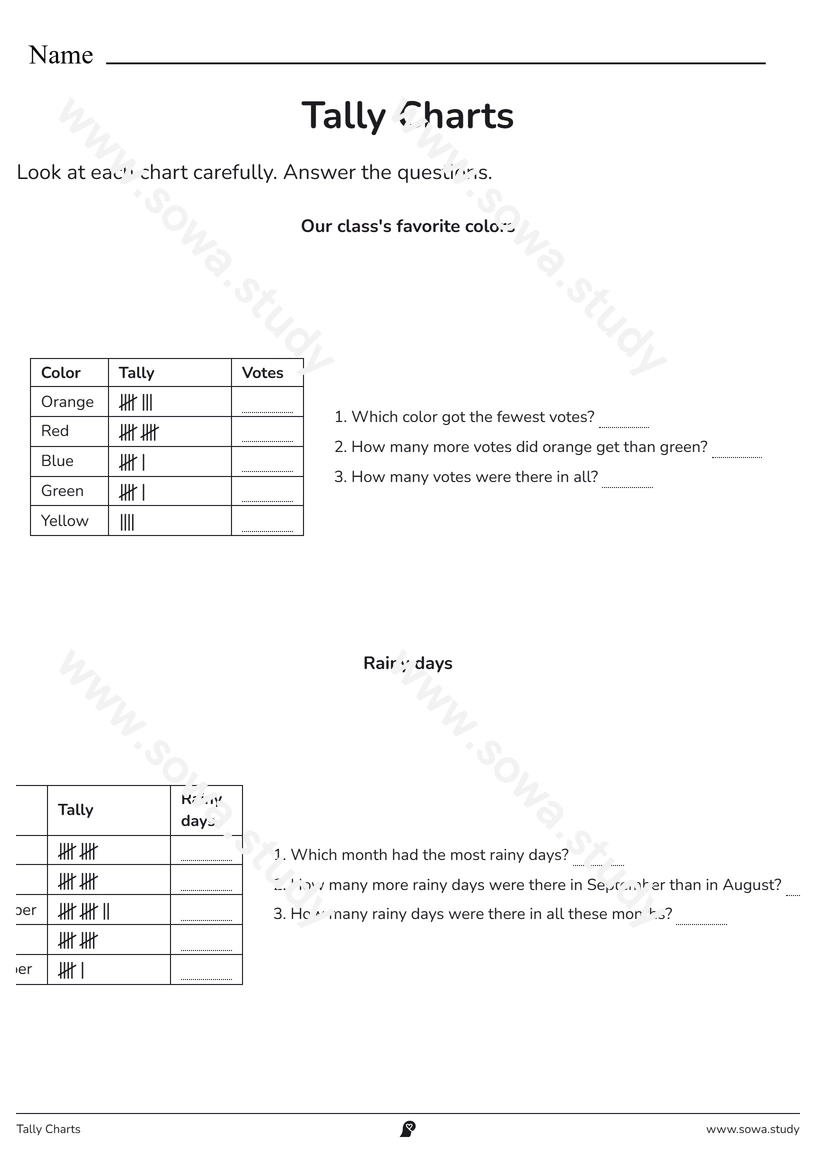
Tally Charts
Count tally marks in fives, write the totals and answer questions about the survey.
 Dynamic
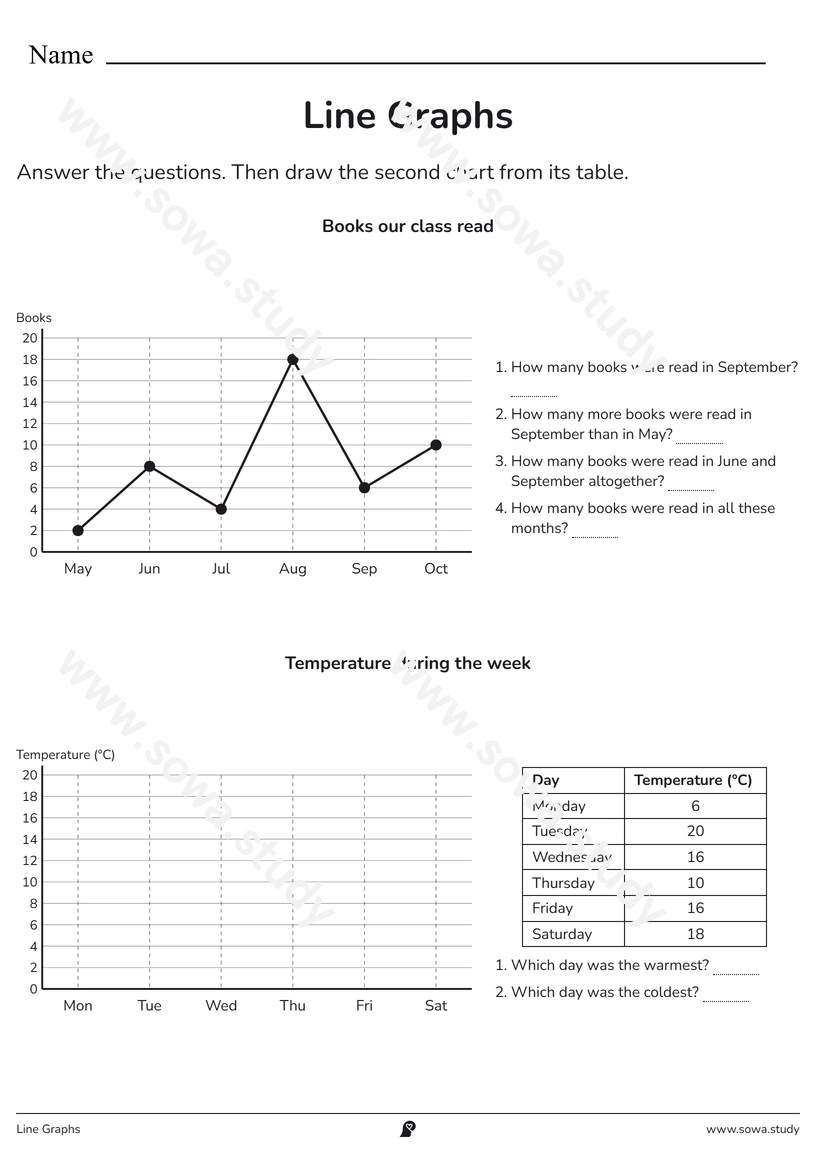
Line Graphs
Read line graphs of temperatures, books and rainy days, then plot one from a table.
 Dynamic
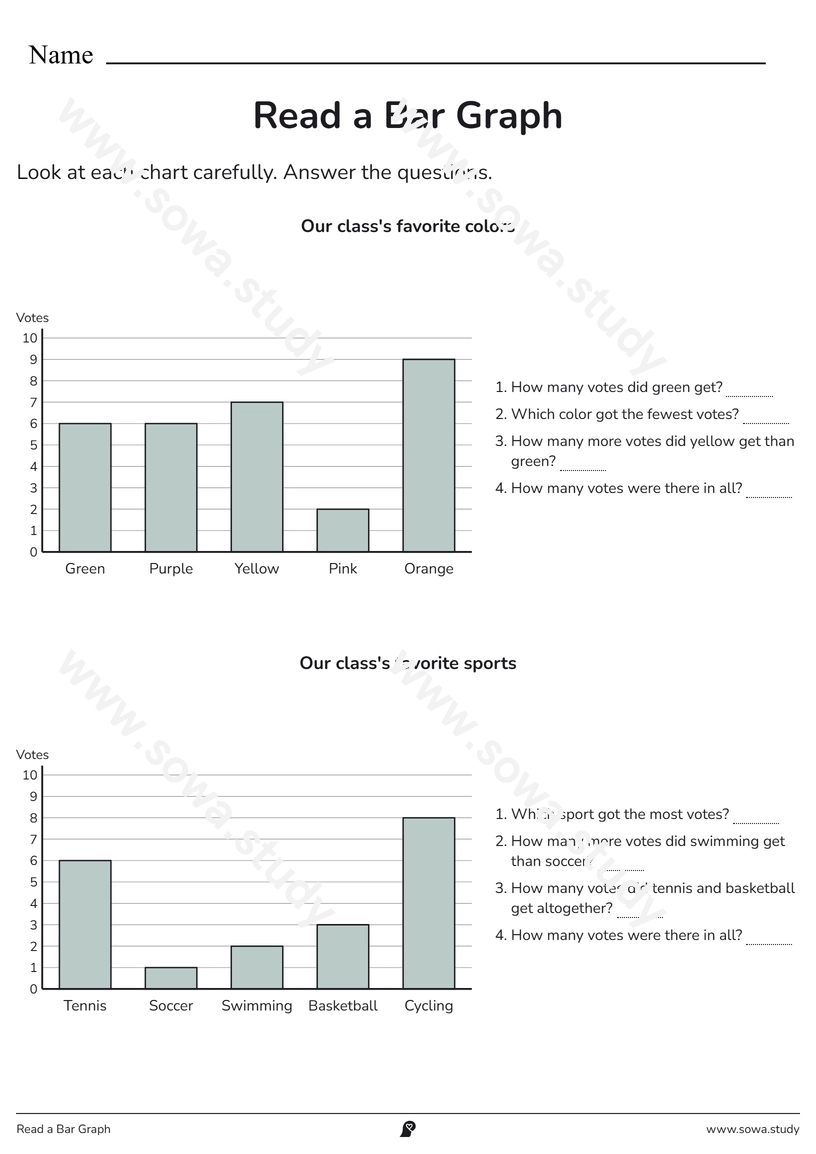
Read a Bar Graph
Read the values off bar graphs with a scale of 1 and answer questions about the data.
 Dynamic
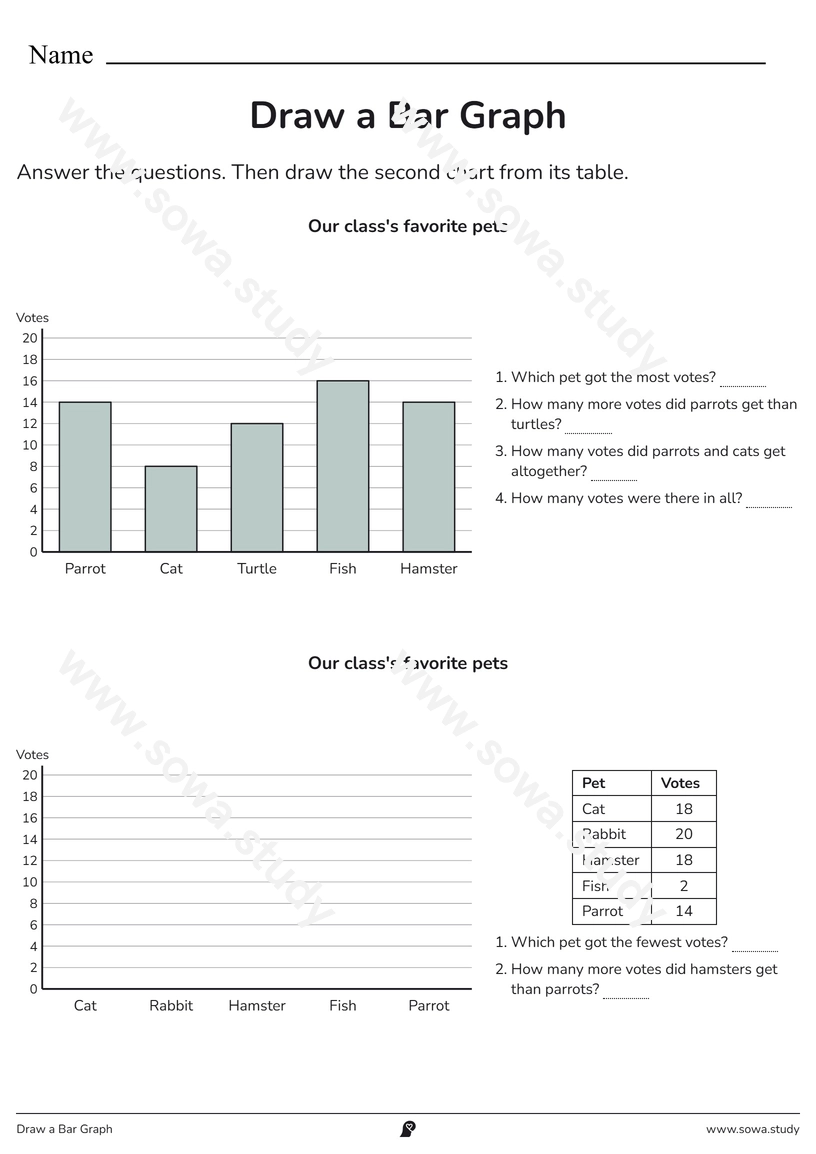
Draw a Bar Graph
Read a bar graph, then draw one from a table of data.